XAML Debugging Tools in Review
In my last review of the new Visual Studio 2015 XAML debugging tools (xaml-debugging-tools-vs-snoop) I found a lot to like but a few key shortcomings compared to what has been available in Snoop.
Now that the Release Candidate of Visual Studio 2015 has been released the tools are farther along and closer to what their final state will be at RTM. So how are things progressing? Pretty well!
Most of the key features I identified last time are the same but getting more polished overall. Most of the new changes are in the Live Property Explorer.
Property Navigation
The “Go To Source” menu option on property values which existed before but were disabled are now working. From my testing it looks like it is enabled and working for any values which are defined in the project source, including Local and also Style properties. Elements which are not explicitly defined (i.e. a TextBlock created for a Button with string Content) can’t be navigated to since they don’t exist in the code, which makes total sense.
Style Resolution
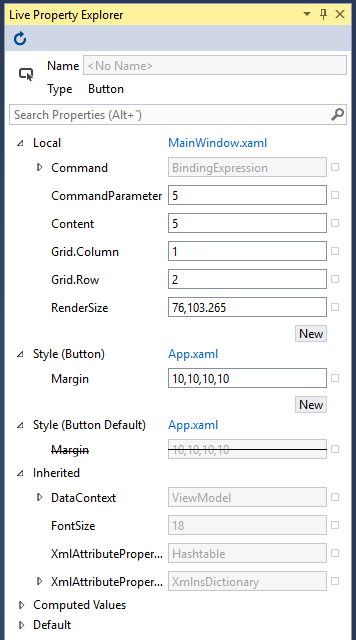
One of the areas that had showed promise but been pretty limited last time around was the Style sections of the property grid. The labeling of the Styles is a lot more clear, showing the x:Key or TargetType and clearing labeling default Styles. Labeling seems to have been cleaned up in general, with no more full namespace type names showing up, for example.
Properties which have been reset downstream are also now clearly identified with a strikethrough over the original value. This applies not just to Styles but also lower priority setters, like default values for the type. Styles also display a clear link to jump to the file where they’re defined (in addition to the similar property menu functionality).
DataContext Details
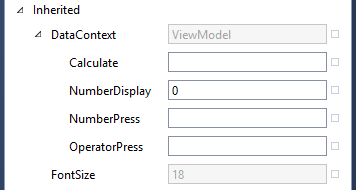
This one was a pleasant surprise. I originally identified the lack of a DataContext drilldown as the main thing that would keep me using Snoop in addition to the new tools. But now the single DataContext property field that showed just the type has turned into an expandable tree view. It appears to list all the properties and even allows editing values. From what I’ve seen so far this looks to be exactly what I use Snoop’s DataContext tab for and should be a great replacement.
I’m really excited to start using these tools all the time. Along with the new Diagnostic Tools window there’s a ton of great information about your XAML app now available in every debug session!