*Update for new RC features: changes-to-visual-studio-2015-xaml-debugging-tools-in-rc
Anyone who has done a significant amount of work in WPF is probably familiar with XAML debugging tools like Snoop. A few other tools have come along since with similar functionality that also works across different XAML platforms, but for WPF Snoop still packs a punch. Finally, after almost a decade, Visual Studio is getting the kind of visual tree debugging that’s been an essential part of XAML development (and it will work on all XAML platforms). But given that the tools are brand new (actually still in pre-release, CTP6, as of now) and live inside VS itself rather than a standalone app, how do they stack up?
Visual Tree
The most important element of both tools is the live tree view listing the application’s visual tree. Snoop set a good standard for this tool and Visual Studio has followed it closely, with similar child element count indicators and auto-expansion to locate a selected element from in the app. Visual Studio does add some nice iconography and overall the window looks more professional (as well it should).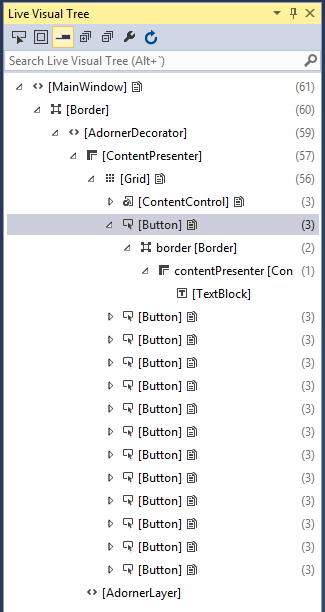
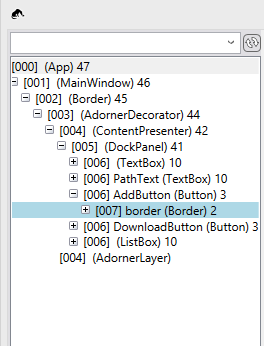
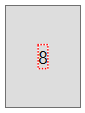
VS has a nice filtering search box that looks for types or element Names like Snoop, but the filtered results also show the parent hierarchy of each match. The in app element selection behaves a little differently in each tool but they both get the job done. The VS element highlighting shown here is similar to Snoop’s red framing.
The first obvious difference with running the new VS tools is in its relationship to your running app. Where Snoop requires leaving its floating window around and separately attaching to your app each time it runs, the VS tools are automatically attached as you start debugging. Snoop also requires positioning its window somewhere convenient usually around both your app and VS. The new tools are just a couple normal Visual Studio tool windows and as such can be docked anywhere as part of the debug window layout. There are definitely some possible disadvantages to having the tools inside VS – primarily on a single monitor setup which will often require moving the whole VS window to avoid overlapping your app while navigating through the visual tree. On multi-monitor setups I think the VS setup is going to work out well, especially while jumping back and forth between the visual tree and other VS tools like the Output window and editor breakpoints.
Property editing
In Snoop, the biggest part of the default window layout is taken up by a comprehensive listing of all the properties set on the selected element. There are some decent options for filtering but a lot of times this view shows a lot of extra noise around the few pieces of data you really want to see.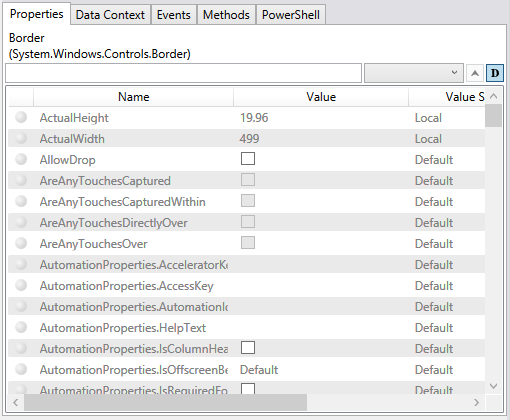
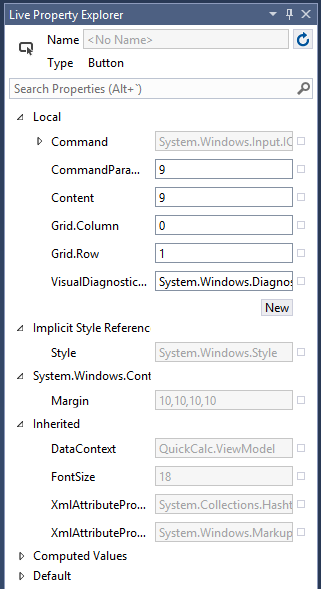
In Visual Studio the property list comes in a separate tool window that starts with a similar basic setup as you see in the XAML editor’s property grid. The big obvious difference is the organization of the properties. All are split up into a tree view that groups properties by how they are set: Local, Inherited, Default, etc. This info is available in Snoop individually on each property but in practice should be more useful in the way that VS exposes it. One limitation of VS is that the selection of properties that can be edited appears to be limited to Local set properties, while Snoop lets you change just about anything that’s not readonly. There is a big potential advantage possibly coming in the final version of the tools in pushing edits made live directly back to the source and another discussed in the next section.
This is the area where having tools built into VS becomes a big advantage and is probably going to be the most useful feature. One of the options in the header of the visual tree window (also in the context menu on each element) syncs up the editor window location with the current element selection. In my testing this appears to work well, even finding elements inside ControlTemplates and implicit DataTemplates located in other files. This is going to save a lot of time versus the manual hunting required when using Snoop. Additionally, although it doesn’t appear to be working yet, the property grid has a menu option for each property to Go To Source, which could mean easy location of even inherited and Style properties without having to manually walk the visual tree and dig through resources. It’s not clear yet if this will work in the final version but I’m hopeful that it does make it.
Snoop Extras
Now for the bad news. Snoop is packed with a lot of additional functions that don’t show up in the VS tools (and are unlikely to) like element zooming, event reporting, and method execution. Most of these are things I don’t find myself using too often and some of these already have roughly equivalent functionality in VS while debugging, like through the Immediate window. Binding error highlighting is one thing I hope makes it in at some point as that can be much more useful than just digging through the Output window messages.
By far the biggest missing feature for me is the DataContext tab (which shows a drilldown view of the current selection’s DataContext) and there doesn’t appear to be anything equivalent currently in or planned for this release in VS. So it may not be time to completely abandon Snoop (or your other visual tree debugger of choice). Hopefully this will be high up on the list for the next release of the tooling, which with the faster release cadence of VS shouldn’t be too far away.